Breakout penny stocks are the stuff of dreams for most day traders; when they occur, a simple trade can balloon into something spectacular. Often breakout penny stocks can deliver gains north of 800% on a solid day. But how do you spot them? How does a day trader get into breakout penny stocks before they become monsters? It’s not as difficult as many believe and in this brief article we’ll show you how. After this you should be able to move comfortably into a penny stocks before it becomes a breakout penny stock – and perhaps, do what most dream of, secure a massive payday.
Breakout Penny Stocks – What Is a Breakout Anyway?
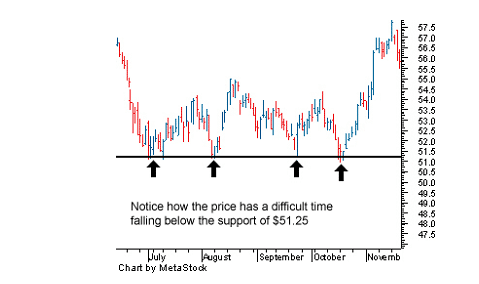
A breakout occurs when a stock’s price moves (rather violently) outside a defined resistance or support level. This is key. Mess up the definition of the levels and you won’t be able to properly gauge the pattern. Before you can securely gauge the pattern, you need to have a solid understanding of what a support and resistance level is. A support level is a price point which historically, a stock’s price has difficulty falling below. It’s like a bottom that refuses to budge lower. The graph below illustrates this principle…
Source: Investopedia
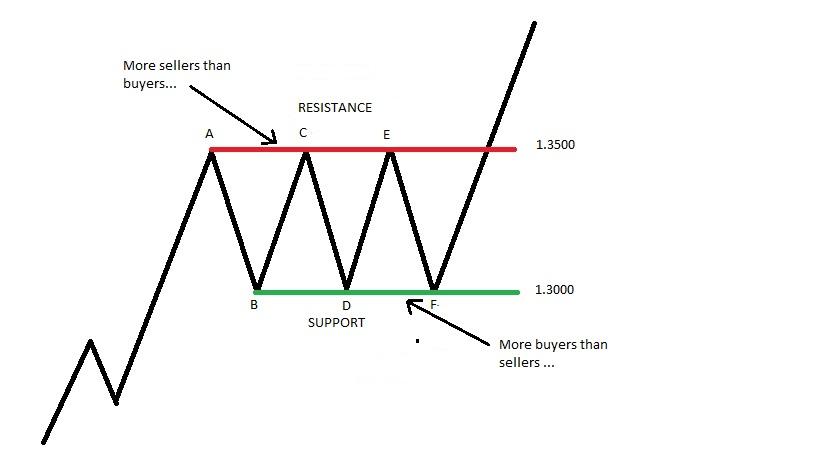
Resistance is the opposite of support, representing a price point above which a stock’s price has historically failed to penetrate. It’s like a ceiling that’s made of a hard substance. In both cases, support and resistance levels, a day trader is looking at areas of considerable pressure. Breakout penny stocks converge at the upward points of this pressure curve. As you can imagine, they are a boon when they pop.
In order to keep alert for a breakout you need to be tracking the support and resistance levels for a given stock over time. These time periods can be anything depending on your trading style as breakout patterns can occur over any time frame. A typical penny stock could in theory have multiple resistance points set on any given day. This could be extrapolated over 3 days (a swing trade) or even over a month. It all depends on what your time horizon is for trading breakout penny stocks.
Breakout Penny Stocks – Triangle Breakout Pattern
There are many breakout patterns but one that is frequently used to size up a trade is called the triangle pattern. As you can see in the graph below, the horizontal line represents the upward pressure points (resistance) that have been established for a particular security.
Source: Prophet.net
In terms of planning your entry, you need two things: 1) Validity and 2) consistency. Validity means that the upward pressure points have been observed accurately and are true resistance touch points for a particular stock. Consistency gives you the knowledge you need to have to gauge pressure accurately. The more a stock’s price touches these resistance levels, the more one can deduce that there is pressure. When the stock eventually breaks through this resistance level it’s like a dam. A raging torrent ensues and there is no telling how high breakout penny stocks can go.
And how often can you execute such a trade? It’s really up to you. Some traders play the breakout game every day, often in multiple positions within a short space of time (1 hour). Others take a longer view but the outcome is still the same: breakout penny stocks delivering the goodies for those that know how to spot them.
Of course you don’t have to spend years learning how to spot breakout penny stocks. That learning curve could hold you back. We believe in the power of leverage so we are always encouraging our traders to seek out the best source for Breakout Penny Stocks. Find one and use it.


